CS480X Final: FY2019 Federal Contract Analysis
- 1 minI worked with Nicolas Johnson on the CS480X Data Visualization final project. We decided to tackle visualizing the federal government’s awarding of contracts in FY2019. We used public data from USASpending.gov which includes data (such as amount, company, state, congressional district, and much more) for over 5 million contracts.
Using D3, we created an opening animation to help visualize the amount of money involved in all of the contracts. This animation also provided cover for the large amount of data that the main visualization loads.
We also included a short walk through of some individual data points that we found interesting. This also served as an explanation of what the user sees in the main visualization.
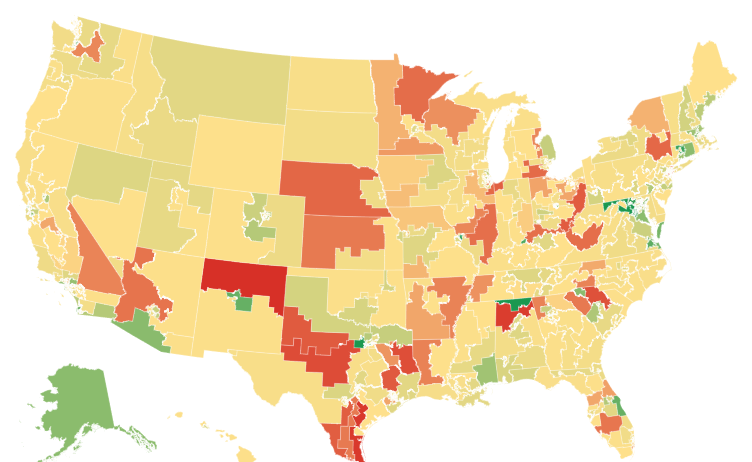
The main visualization includes a map (which toggles between a state view and a congressional district one) and two panes for viewing more information about selected geographic regions. The panes include regional breakdowns based on contract size, the agency that awarded the contract, and the company that received the contract. The main page also includes credits basic instructions.
One of the more challenging parts of this that I worked on was the different sections of the main visualization. I chose to use several nested SVGs so that I could have the state and district selection drawers off to the side and clipped from view. The nested SVG for the map also clips the map when the user zooms in or pans.
Another challenge was map panning and zooming - I initially used D3’s builtin features, but these proved insufficient for limiting the user’s panning. At the suggestion of Professor Harrison, I switched to using EasyPZ, although to say that it glitches when using Chrome is an understatement.
Overall, this was a fun project and I hope to return to the data in the future - there is a lot more to extract.